Nebula Measurement Results Calendar Week 42
Nebula Measurement Results Calendar Week 42
General Information
The measurements were conducted on the following machine:
vCPU-4RAM-8GBDisk-160GBDatacenter-nbg1-dc3Country-GermanyCity-Nuremberg
The following results show measurement data that was collected in the calendar week 42 from 2021-10-18 to 2021-10-24 UTC in 2021.
- Number of crawls
336 - Number of visits
8,532,595 - Number of unique peer IDs visited
59,083
Timestamps are in UTC if not otherwise indicated.
Agent Versions
Newly discovered agent versions:
go-ipfs/0.10.0/b5b5f09b6-dirty(2021-10-17 23:32:14)go-ipfs/0.9.1/d841f42bb(2021-10-18 10:01:34)go-open-p2p(2021-10-18 13:04:45)RendezvousRAT/server(2021-10-19 11:31:46)go-ipfs/0.9.1/1b6fb661c(2021-10-20 07:30:56)go-ipfs/0.11.0-dev/5a61bed(2021-10-20 17:01:03)go-ipfs/0.11.0-dev/5a61bedef(2021-10-21 10:32:45)github.com/adlrocha/ipfs-lite(2021-10-22 21:00:10)go-ipfs/0.11.0-dev/23442df(2021-10-23 11:03:07)
Protocols
Newly discovered protocols:
/lilu.red/op/1/file(2021-10-18 13:04:45)/lilu.red/op/1/text(2021-10-18 13:04:45)
Classification
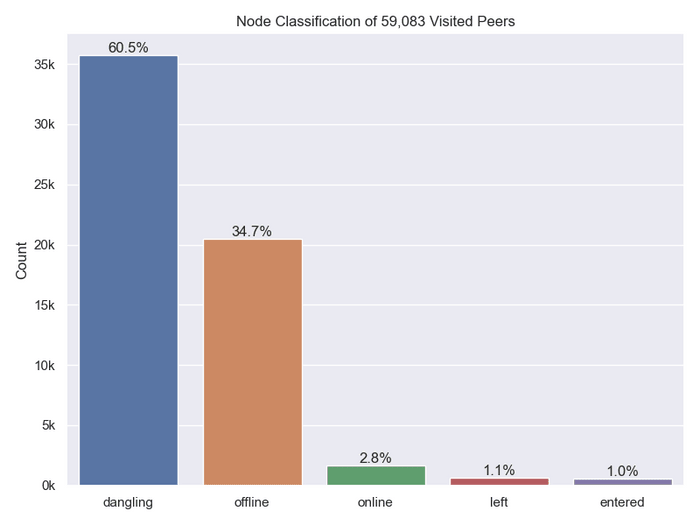
Node classification:
dangling- A peer that was seen going offline and online during the measurement period (potentially multiple times)online- A peer that was not seen offline at all during the measurement period (always online)offline- A peer that was not seen online but found in the DHT during the measurement period (always offline)entered- A peer that was offline at the beginning of the measurement period but appeared within and didn't go offline since thenleft- A peer that was online at the beginning of the measurement period, did go offline and didn't come back online
Crawl Time Series
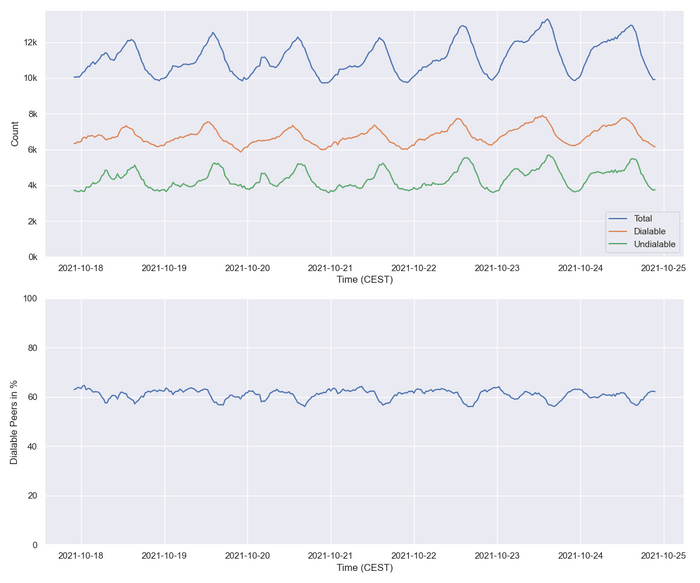
The top graph shows the number of dialable and undialable peers for each individual crawl. Further it shows the sum of both as Total.
The bottom graph shows the percentage of dialable peers in each crawl (Dialable / Total)
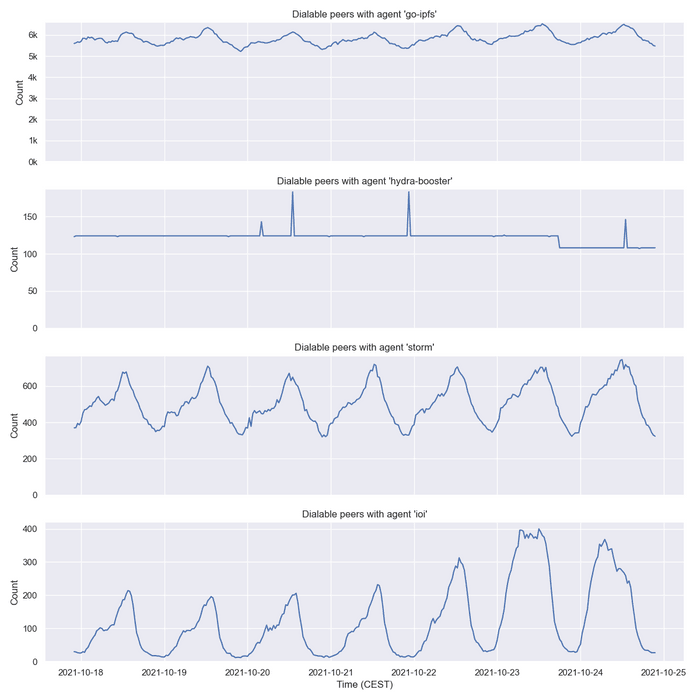
By Agent Version (selection)
Churn
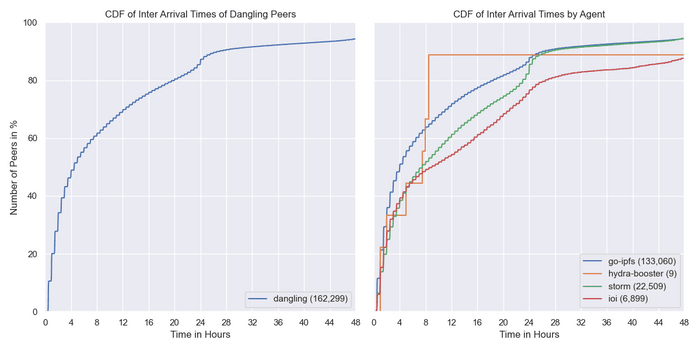
Inter Arrival Time
Agent Version Analysis
Overall
These graphs show the agent version distribution that was observed during crawling the network. The number next to Total indicates the number of successful crawl visits that contribute to the distribution.
Dangling Nodes Only
These graphs show the agent version distribution that was observed during crawling the network of only the dangling nodes. The number next to Total indicates the number of successful crawl visits that contribute to the distribution.
Online Nodes Only
These graphs show the agent version distribution that was observed during crawling the network of the nodes that were online the whole measurement period (very stable peers). The number next to Total indicates the number of successful crawl visits that contribute to the distribution.
Geo location
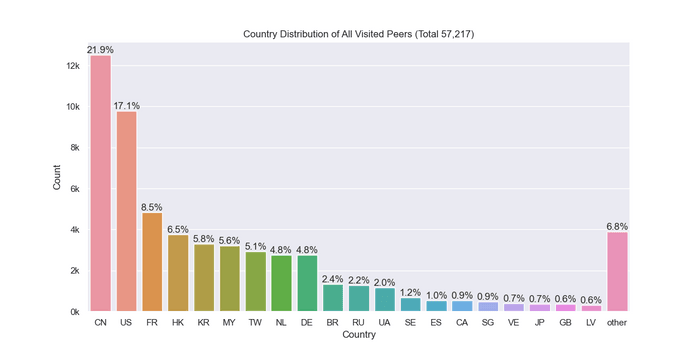
All
Geo locations of all visited peers.
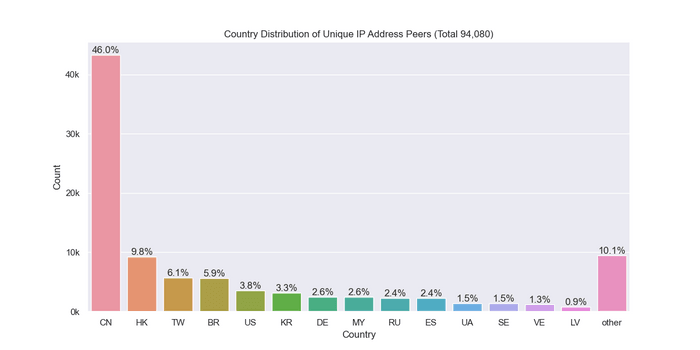
Unique
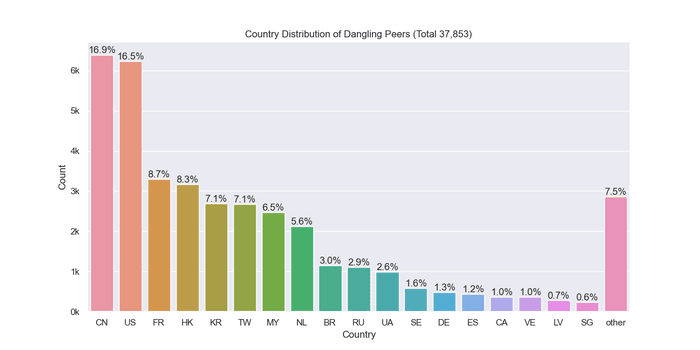
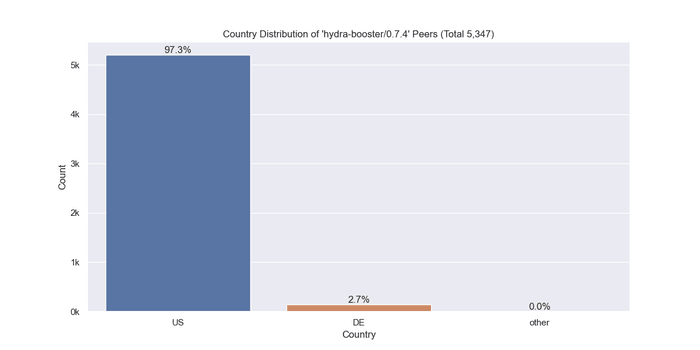
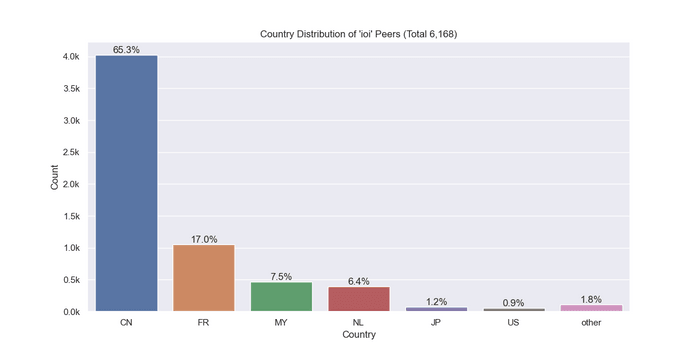
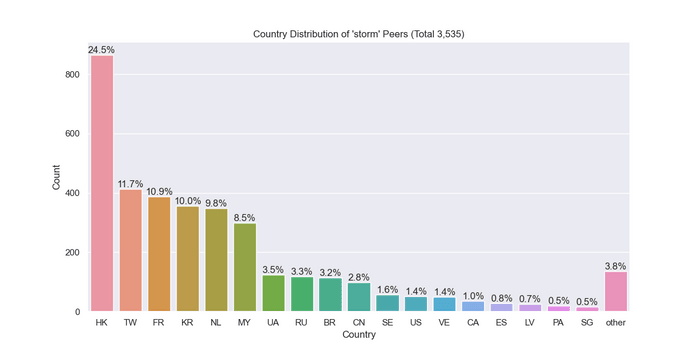
This graph shows the country distribution of all seen unique IP addresses during the measurement period.
Classification
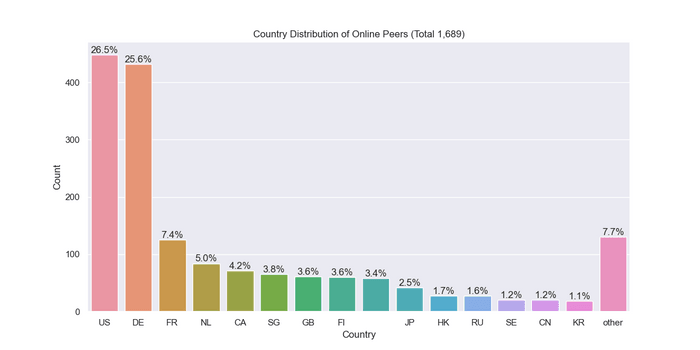
Online
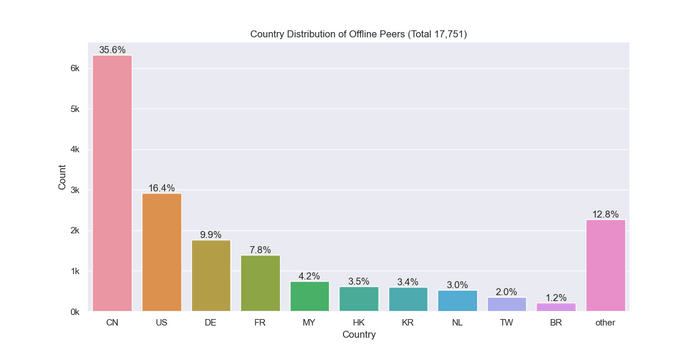
Offline
Dangling
Agent Version
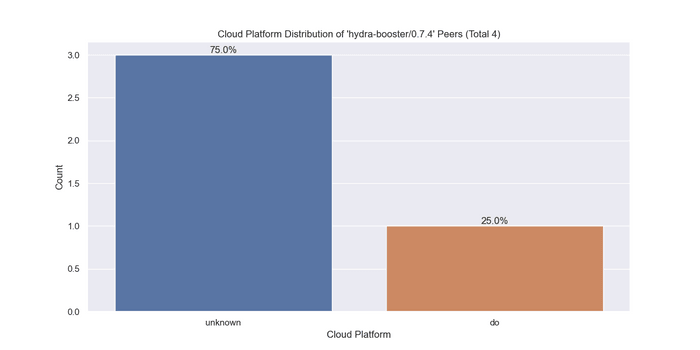
Hydra
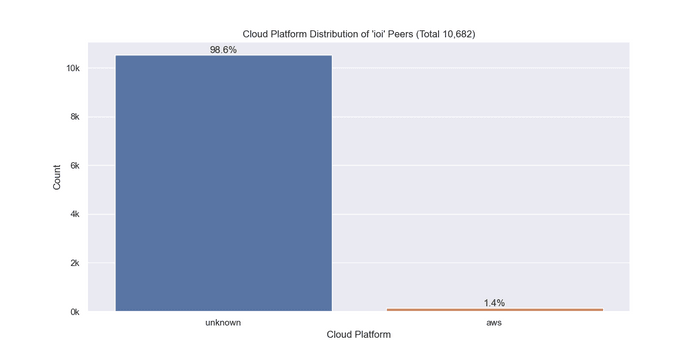
ioi
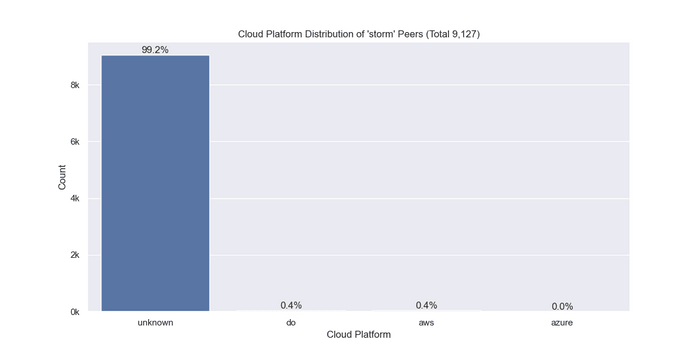
storm
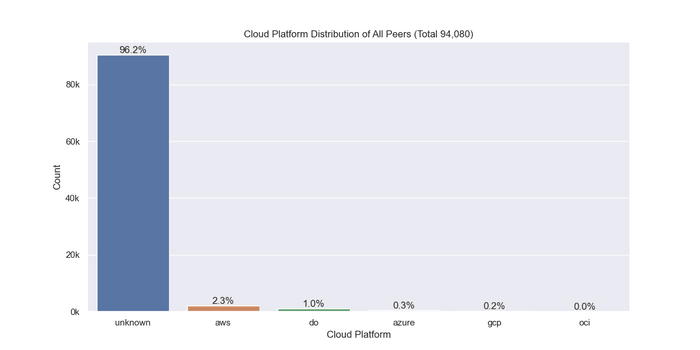
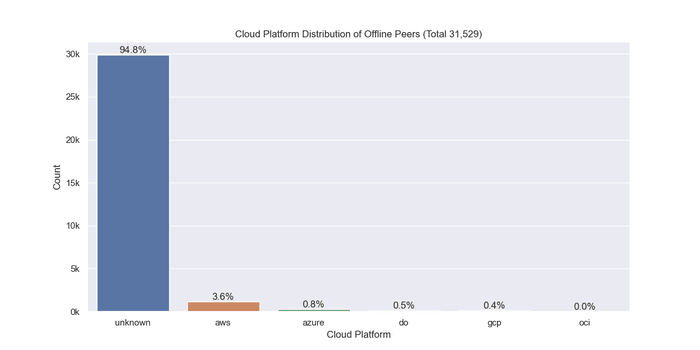
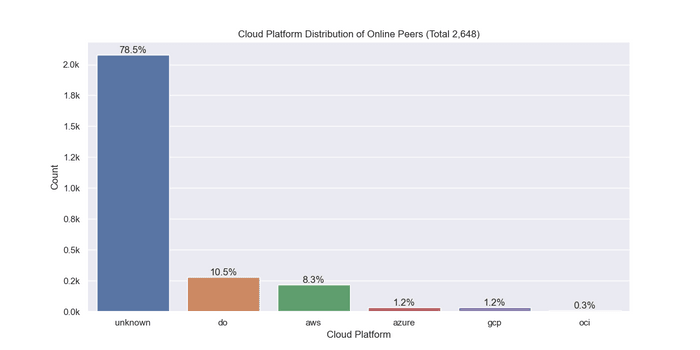
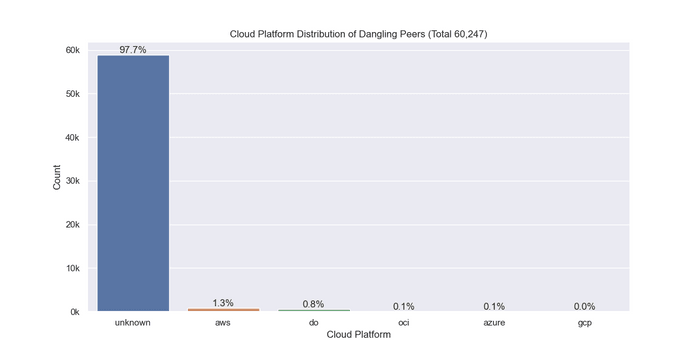
Cloud
The number next to Total indicates the number of unique IP addresses that went into this calculation.
All
Classification
Offline
Online
Dangling
Agent Version
Hydra
ioi
storm
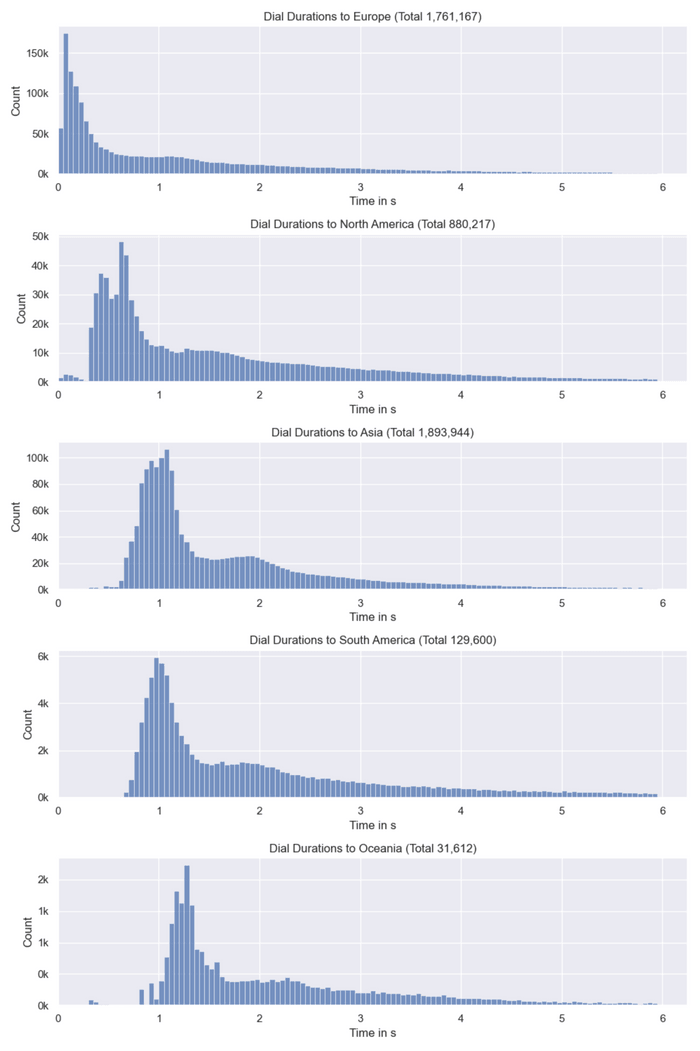
Latencies
Overall
Connect measures the time it takes for the libp2p host.Connect call to return. This involves several hand shakes under the hood (includes the dial duration as well).
Connect plus Crawl includes the time of dialing, connecting (as explained above) and crawling the peer. Crawling means the time it takes for the FIND_NODE RPCs to resolve. Nebula is sending 15 of those with increasing common prefix lengths (CPLs) to the remote peer in parallel.
